
Analysis of Bivariate Data
Analysis of Bivariate Data: Overview
This Topic covers sub-topics such as Correlation, Correlation Coefficient, Types of Correlation, Pearson Correlation Coefficient, Causation, Positive Correlation, Negative Correlation, Significance of Correlation and, Perfect Positive Correlation
Important Questions on Analysis of Bivariate Data
How do lurking variables affect a statistical study?
Define lurking variable with example.
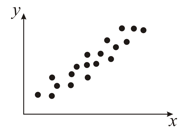
State whether you would use Pearson's product moment correlation coefficient to measure the strength of the correlation, for the given scatter plot.
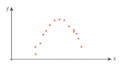
State whether you would use Pearson's product moment correlation coefficient to measure the strength of the correlation, for the given scatter plot.
State whether the following statement is true or false.
Two variables are negatively correlated if they move in opposite directions.
State whether the following statement is true or false.
Two variables are positively correlated when they move together in the same direction.
Consider the following statements :
- Two independent variables are always uncorrelated.
- The coefficient of correlation between two variables is positive. When decreases then decreases.
Coefficient of Correlation is:
What is the value that implies no relation between the variables?
In the given table,find the correlation coefficient for the set of data. Describe the relationship between the variables.
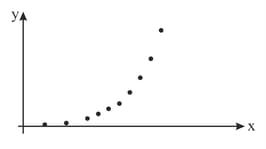
Describe whether in the given graph as having a positive correlation, a negative correlation or no correlation.

Mark karly said, " All causation is correlation, but not all correlation is causation." Explain what Mark karly meant.
Which correlation coefficient value(s) indicate that a change in one variable causes a change in the other?
Using the correlation coefficient for the following set of data, explain the relationship between the variables as positive or negative and as strong, moderate or weak.
Explain whether the following graph as having a positive correlation, a negative correlation or no correlation. For those with a correlation, state whether the correlation is strong, moderate or weak.
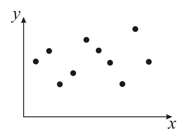
Explain whether the following graph as having a positive correlation, a negative correlation or no correlation. For those with a correlation, state whether the correlation is strong, moderate or weak.
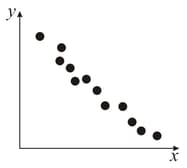
Explain whether the following graph as having a positive correlation, a negative correlation or no correlation. For those with a correlation, state whether the correlation is strong, moderate or weak.
What is the value of ‘’ when two variables are uncorrelated?
Which correlation coefficient value(s) indicate that a change in one variable causes a change in the other?
If the two variables do not have linear relationship between them then they have a correlation coefficient equal to


